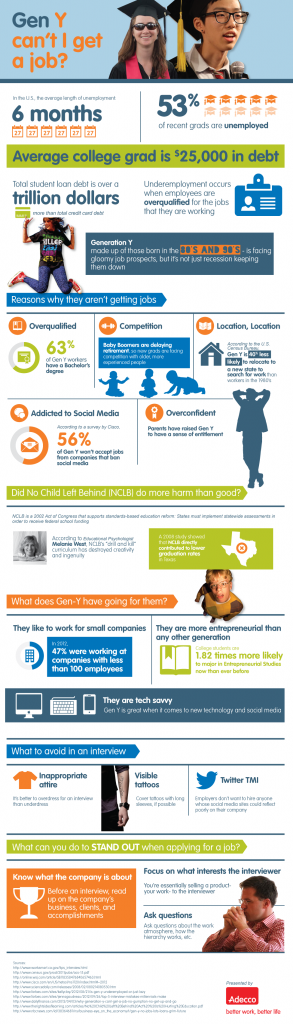
Gen Y Can’t I Get a Job? [Infographic]
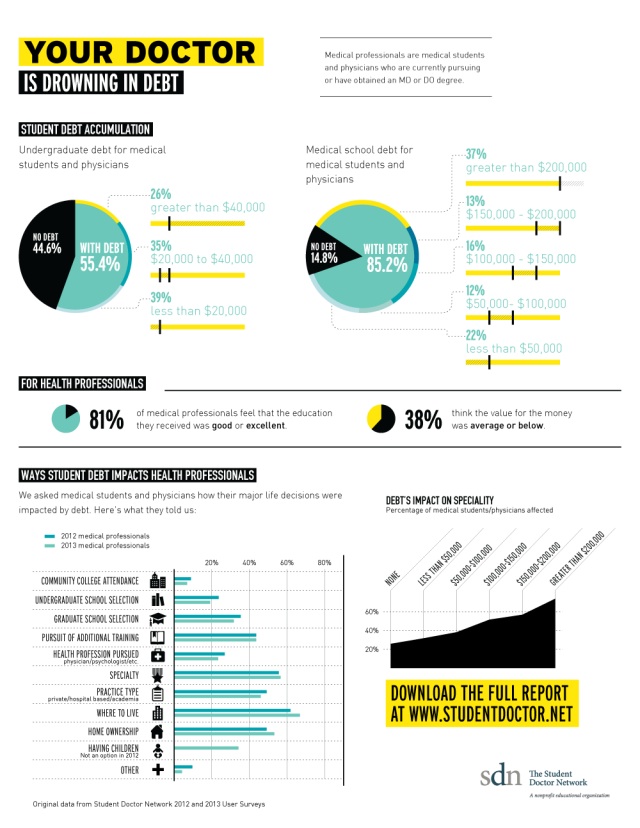
For years, individuals and organizations have pushed education as the key to success in America. But is that really true? Generation Y, those children of the 1980’s and 1990’s, are graduating with bachelor’s degrees and yet 53 percent of them are unemployed. In this infographic, the folks at Adecco look at the numbers and facts […]
Gen Y Can’t I Get a Job? [Infographic] Read More »